Transactions

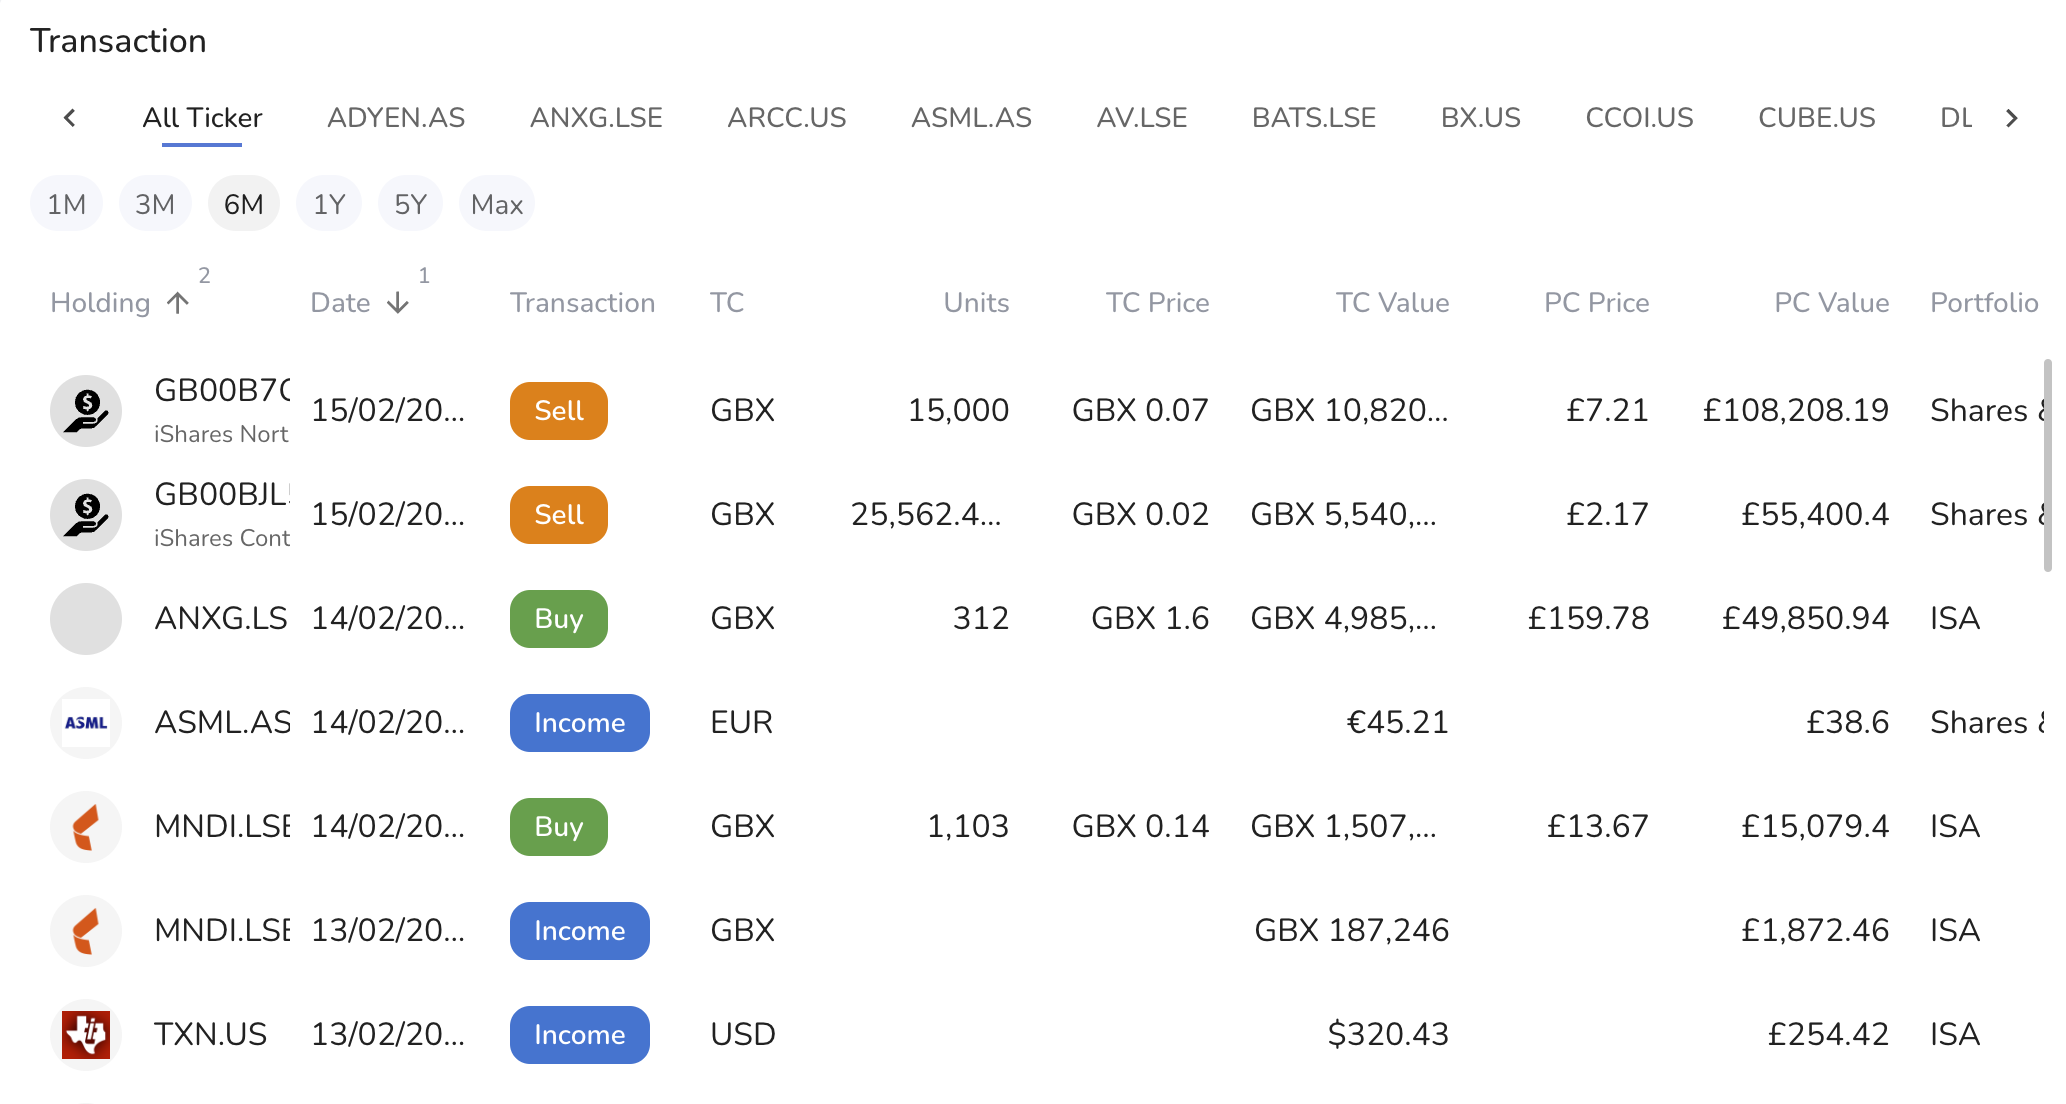
The Transaction Display widget provides a comprehensive overview of all transactions related to the user's stock holdings. It offers detailed information about each transaction and allows users to sort, filter, and manage the displayed data. This widget supports multiple time intervals and specific stock tickers, making it a versatile tool for tracking and analysing portfolio activities.
Features
-
Detailed Transaction Data:
- Holding: Name of the stock or asset involved in the transaction.
- Date: The date when the transaction took place.
- Transaction Type: Type of transaction (e.g., Buy, Sell, Income).
- Trading Currency (TC): Currency in which the transaction was conducted.
- Units: Number of units involved in the transaction.
- Transaction Price (TC Price): Price per unit at the time of the transaction.
- Transaction Value (TC Value): Total value of the transaction in the trading currency.
- Portfolio Currency (PC Price): Price per unit converted to the portfolio currency.
- Portfolio Value (PC Value): Total value of the transaction in the portfolio currency.
- Portfolio: The specific portfolio account (e.g., ISA, Shares) associated with the transaction.
-
Time Interval Selection:
- Users can choose to display transactions from different time intervals: 1 month, 3 months, 6 months, 1 year, 5 years, or maximum available period.
-
Ticker Filtering:
- The widget allows filtering transactions by specific stock tickers. Users can select "All Ticker" to view all transactions or pick individual tickers for focused analysis.
-
Column Management:
- Sort: Columns can be sorted in ascending or descending order.
- Pin: Columns can be pinned to the left or right for easier comparison.
- Filter: Users can apply filters to columns to focus on specific data points.
- Hide/Show Columns: Users can hide or show specific columns to customize the display.
-
Filter Operations:
- The widget supports various filter operations such as "contains," "equals," "starts with," "ends with," "is empty," "is not empty," and "is any of." This allows users to fine-tune the displayed transactions according to their criteria.
Usage
-
Viewing Transactions:
- Select the desired time interval (e.g., 1M, 3M, 6M, 1Y, 5Y, Max) to filter transactions within that period.
- Use the ticker filter at the top to select specific holdings or view transactions for all tickers.
-
Sorting and Filtering:
- Click on the column headers to sort transactions by date, type, value, etc.
- Use the filter icon in the column headers to apply specific filters. Choose the filter operation and enter the desired value to narrow down the data.
-
Customizing Columns:
- Click on the three dots icon in the column headers to access options for sorting, pinning, filtering, and managing columns.
- Select "Manage columns" to hide or show columns based on your preferences.
Example
The widget can display a wide range of transactions, from buys and sells to income receipts. For example, a user can view all "Buy" transactions over the past 6 months for a specific stock, sort these transactions by date, and filter out any transactions below a certain value. This level of detail and customization helps users maintain a clear and organized record of their portfolio activities.
By leveraging the Transaction Display widget, users can gain valuable insights into their trading history, monitor portfolio performance, and make informed investment decisions based on historical data.