Profit & Loss Breakdown

Overview
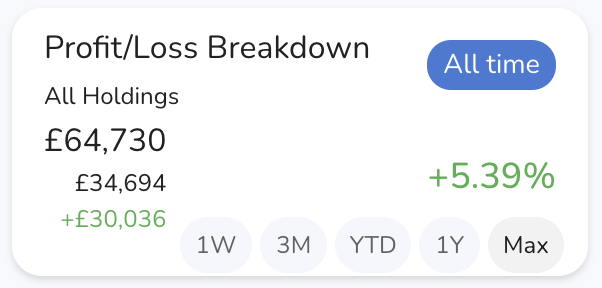
The Profit/Loss Breakdown Widget provides an in-depth analysis of your total financial outcome, segmented into various time frames and types of holdings. This widget helps you understand your portfolio's performance over different periods, showing profits or losses and their sources.
Data Displayed
-
Profit/Loss Breakdown This figure presents your total financial outcome, segmented into 'Dividend Income' and the 'Net of Realized Gains/Losses.' Dividend Income reflects the earnings received from dividend-paying assets. The Net of Realized Gains/Losses represents the actual profit or loss from investments sold, after accounting for their original purchase costs. This breakdown allows for a detailed understanding of your investment performance, showing how much of your total profit or loss is attributable to dividends versus capital gains.
-
Time Frames
- All Time: Displays the profit or loss since the beginning of the portfolio.
- 1W (1 Week): Shows performance over the last week.
- 3M (3 Months): Shows performance over the last three months.
- YTD (Year to Date): Shows performance since the start of the current year.
- 1Y (1 Year): Shows performance over the last year.
- Max: Shows the maximum period for which data is available.
Settings
-
Accessing Settings:
- Click on the settings icon to open the settings menu.
-
Type of Holdings:
- Dropdown Menu: Select the type of holdings you wish to view from the dropdown menu. Options include:
- All Holdings
- All Stocks
- Dividend Stocks
- Non Dividend Stocks
- ETF
- Funds
- Dropdown Menu: Select the type of holdings you wish to view from the dropdown menu. Options include:
-
Saving Changes:
- After making your selections, click "Save" to apply your changes.
- Buttons:
- Default: Resets the settings to default values.
- Cancel: Discards any changes made.
- Save: Applies and saves the changes.