Stocks Overview

Overview
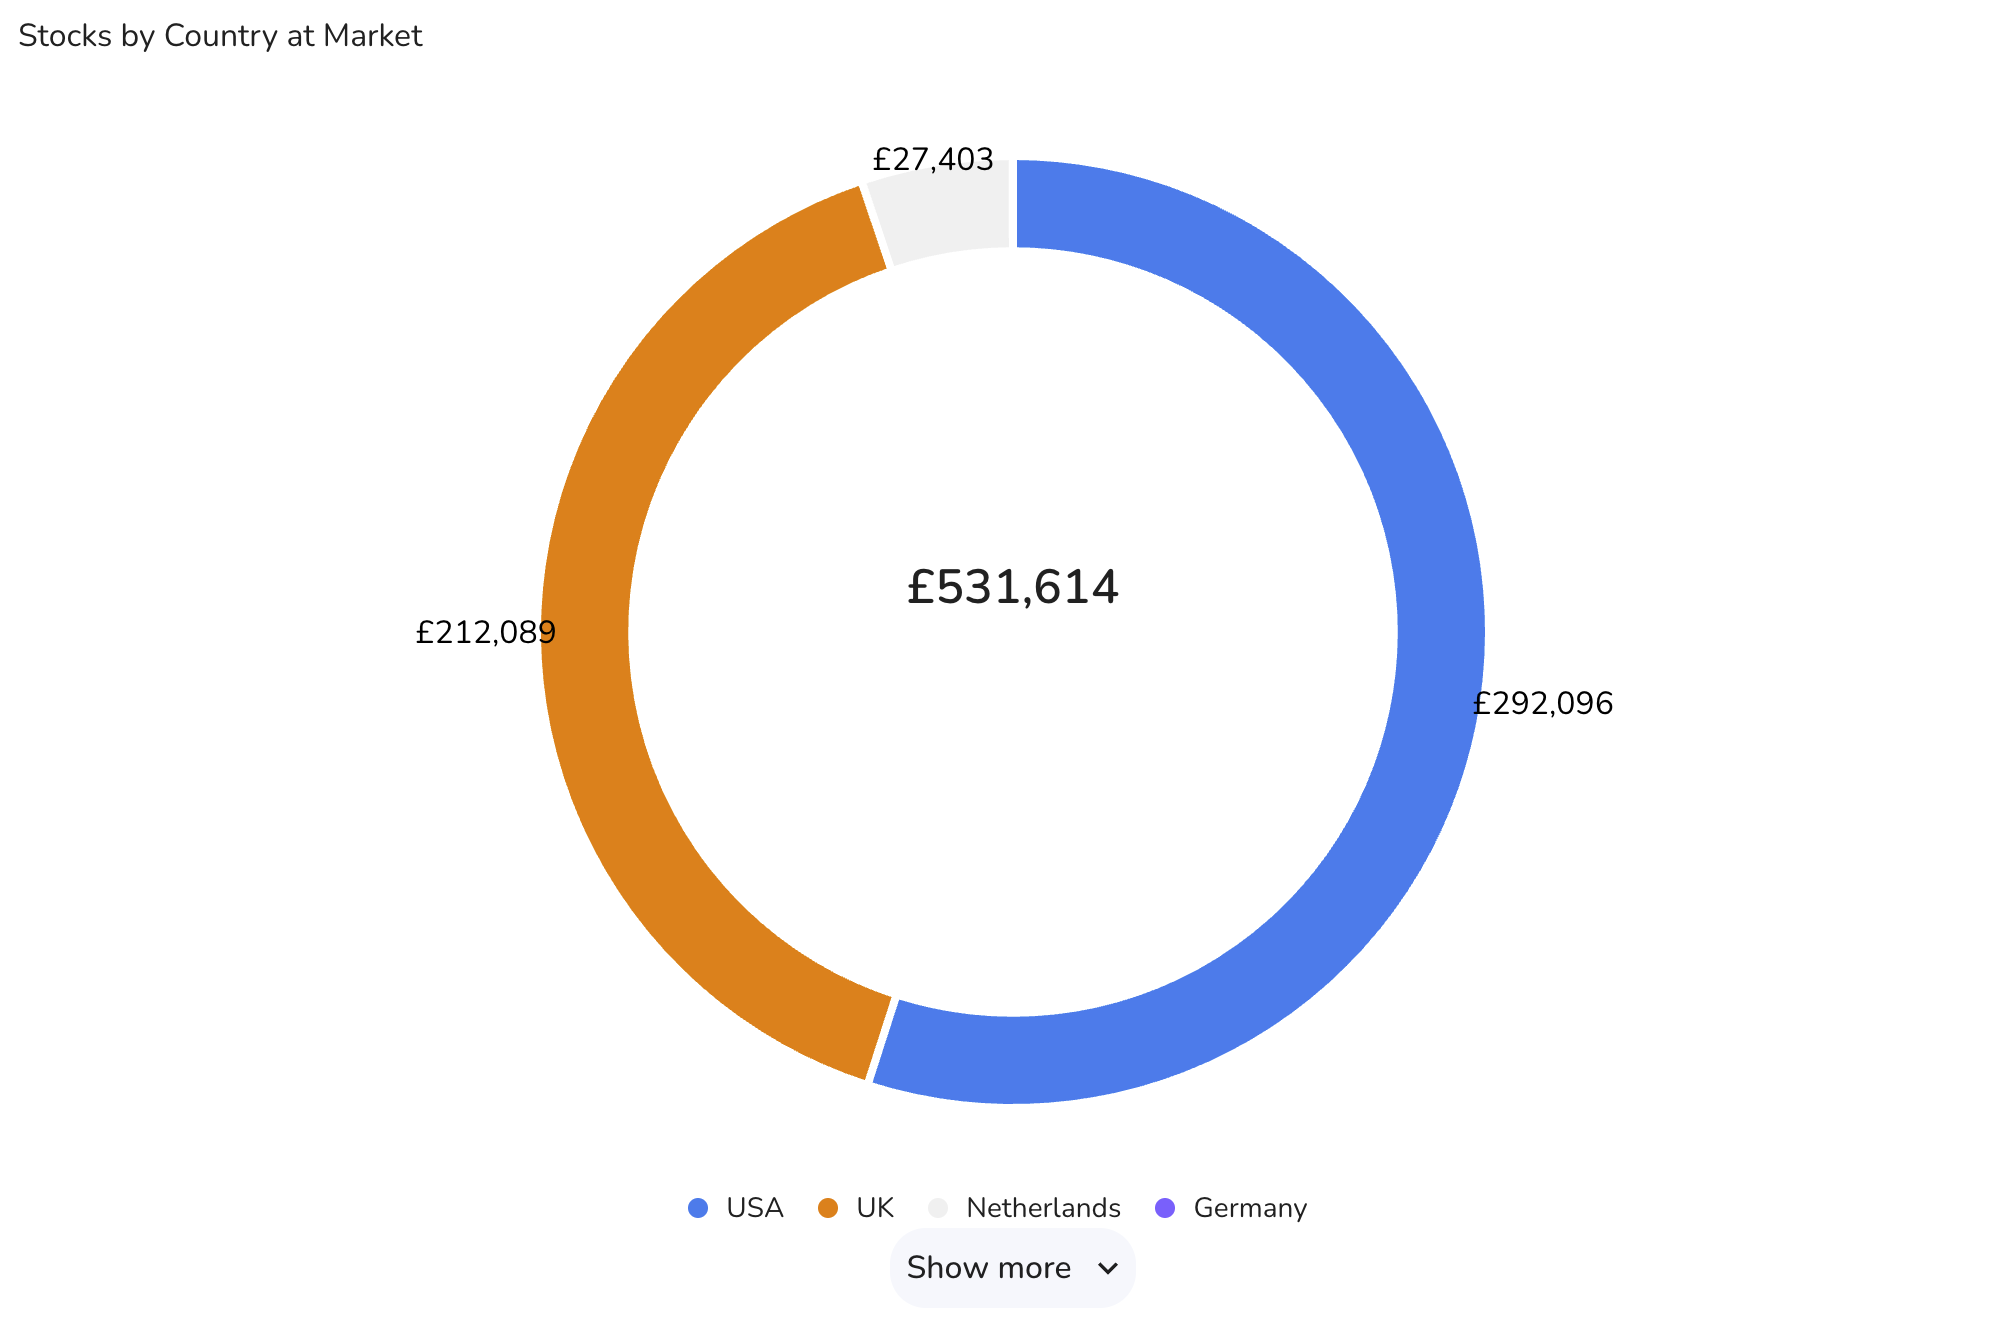
The Stocks Overview Widget provides a detailed analysis of your stock allocations. The data displayed depends on the options chosen in the settings. Users can customize the display to show stocks allocations by country or industry, and view the data in various formats including charts and tables.
Data Display Options
- Allocation By:
- Country: Displays stock allocations by country.
- Industry: Displays stock allocations by industry.
- Value At:
- Market: Shows the current market value of the stocks.
- Cost: Shows the cost value of the stocks.
- Data Display:
- Both: Displays both the chart and the table.
- Chart: Displays only the chart.
- Table: Displays only the table.
- Label:
- None: No labels on the chart.
- Percent: Labels show percentages.
- Value: Labels show actual values.
Chart Types
- Bar Chart: Can be displayed as a vertical or horizontal bar chart showing the allocation of stocks by country or industry.
- Pie Chart: Displays the allocation of stocks as a percentage of the total value.
Settings
- Allocation By: Choose between Country and Industry to categorize stock allocations.
- Options: Country, Industry.
- Value At: Select whether to display the market value or the cost value of the stocks.
- Options: Market, Cost.
- Data Display: Choose the format in which to display the data.
- Options: Both (chart and table), Chart, Table.
- Label: Determine how labels should be displayed on the chart.
- Options: None, Percent, Value.
- Chart Type: Select the type of chart to visualize the stock allocations.
- Options: Pie, Bar.
- Show Total Value: Toggle to display or hide the total value of the stocks in the widget.
- Saving Changes:
- After making your selections, click "Save" to apply your changes.
- Buttons:
- Default: Resets the settings to default values.
- Cancel: Discards any changes made.
- Save: Applies and saves the changes.