Portfolio Value Over Time

Overview
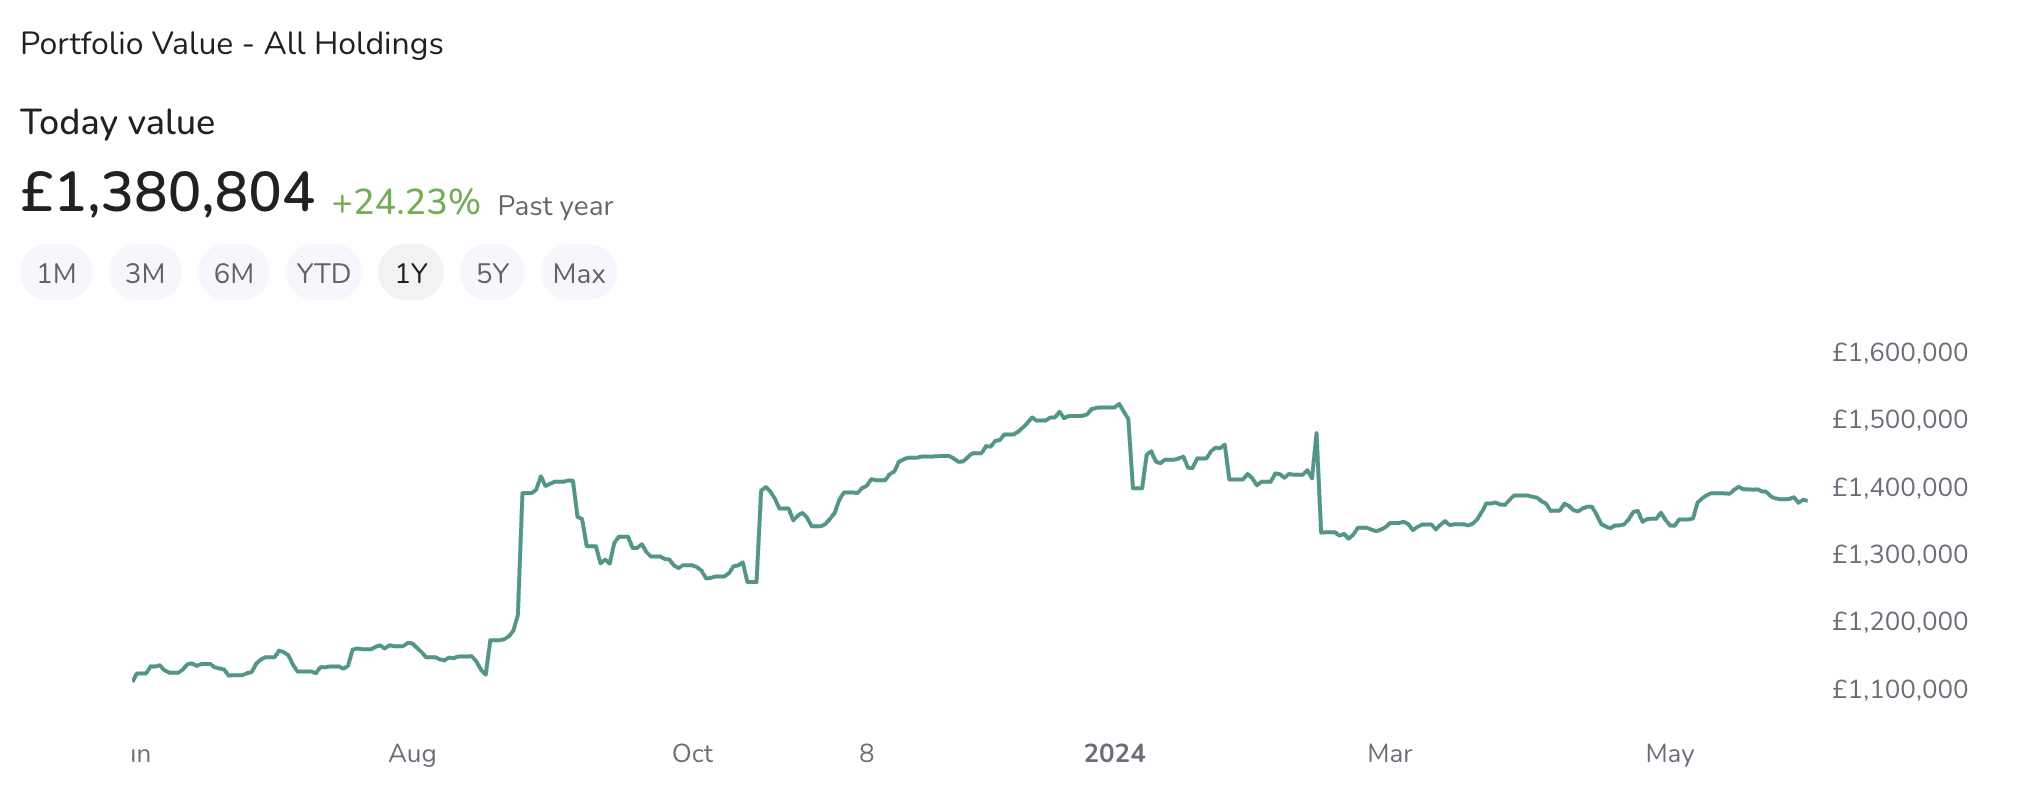
The Portfolio Value Widget provides a comprehensive view of the total value of your investment portfolio over a specified timeline. This widget helps you track the performance and growth of your investments by visualizing changes in market value over different timeframes.
Data Displayed
- Today’s Value: Shows the current total value of your portfolio.
- Performance Percentage: Displays the percentage change in the value of your portfolio over the selected time period.
- Timeframes: Allows you to view portfolio performance over various periods, including 1M, 3M, 6M, YTD, 1Y, 5Y, and Max.
Settings
-
Accessing Settings:
- Click on the settings icon to open the settings menu.
-
General Settings:
- Holding Type: Select the type of holdings you wish to view from the dropdown menu. Options include:
- All Holdings
- All Stocks
- Dividend Stocks
- Non-Dividend Stocks
- ETF
- Funds
- Sectors: Choose to filter the view by specific sectors. Options include:
- All Sectors
- Basic Materials
- Communication Services
- Consumer Cyclical
- Consumer Defensive
- Financial Services
- Healthcare
- Industrials
- Real Estate
- Technology
- Holding Type: Select the type of holdings you wish to view from the dropdown menu. Options include:
-
Header:
- Show Header: Toggle this setting to show or hide the header in the widget.
-
Saving Changes:
- After entering all the necessary information, click "Save" to apply your changes.
- Buttons:
- Default: Resets the settings to default values.
- Cancel: Discards any changes made.
- Save: Applies and saves the changes.