Portfolio Forecast
Overview
The Portfolio Forecast widget projects the future value of your portfolio based on specified contributions, withdrawals, and expected growth rate. This widget provides a visual representation of how your portfolio's value is predicted to change over time, helping you plan and manage your investments effectively.
Data Display Options
The data displayed in this widget depends on the settings you choose. The following options are available:
- Display by: You can choose to display the forecast data by year or by month.
- Year of Forecast: Specify the number of years into the future for the forecast.
- Initial Investment Value: Input the current value of your portfolio holdings.
- User Holdings Value: Toggle to manually input your current holdings value if it differs from the initial investment value.
- Annual Holdings Growth Rate: Set the expected annual growth rate of your portfolio.
Contributions
- Amount: Enter the amount of regular contributions.
- Frequency: Choose the frequency of contributions (monthly or yearly).
- Start Date: Set the start date for contributions.
- Finish Date: Set the end date for contributions, if any.
- Lump Sum: Optionally, add a lump sum contribution.
- Lump Sum Date: Specify the date for the lump sum contribution.
Withdrawals
- Amount: Enter the amount of regular withdrawals.
- Frequency: Choose the frequency of withdrawals (monthly or yearly).
- Start Date: Set the start date for withdrawals.
Chart
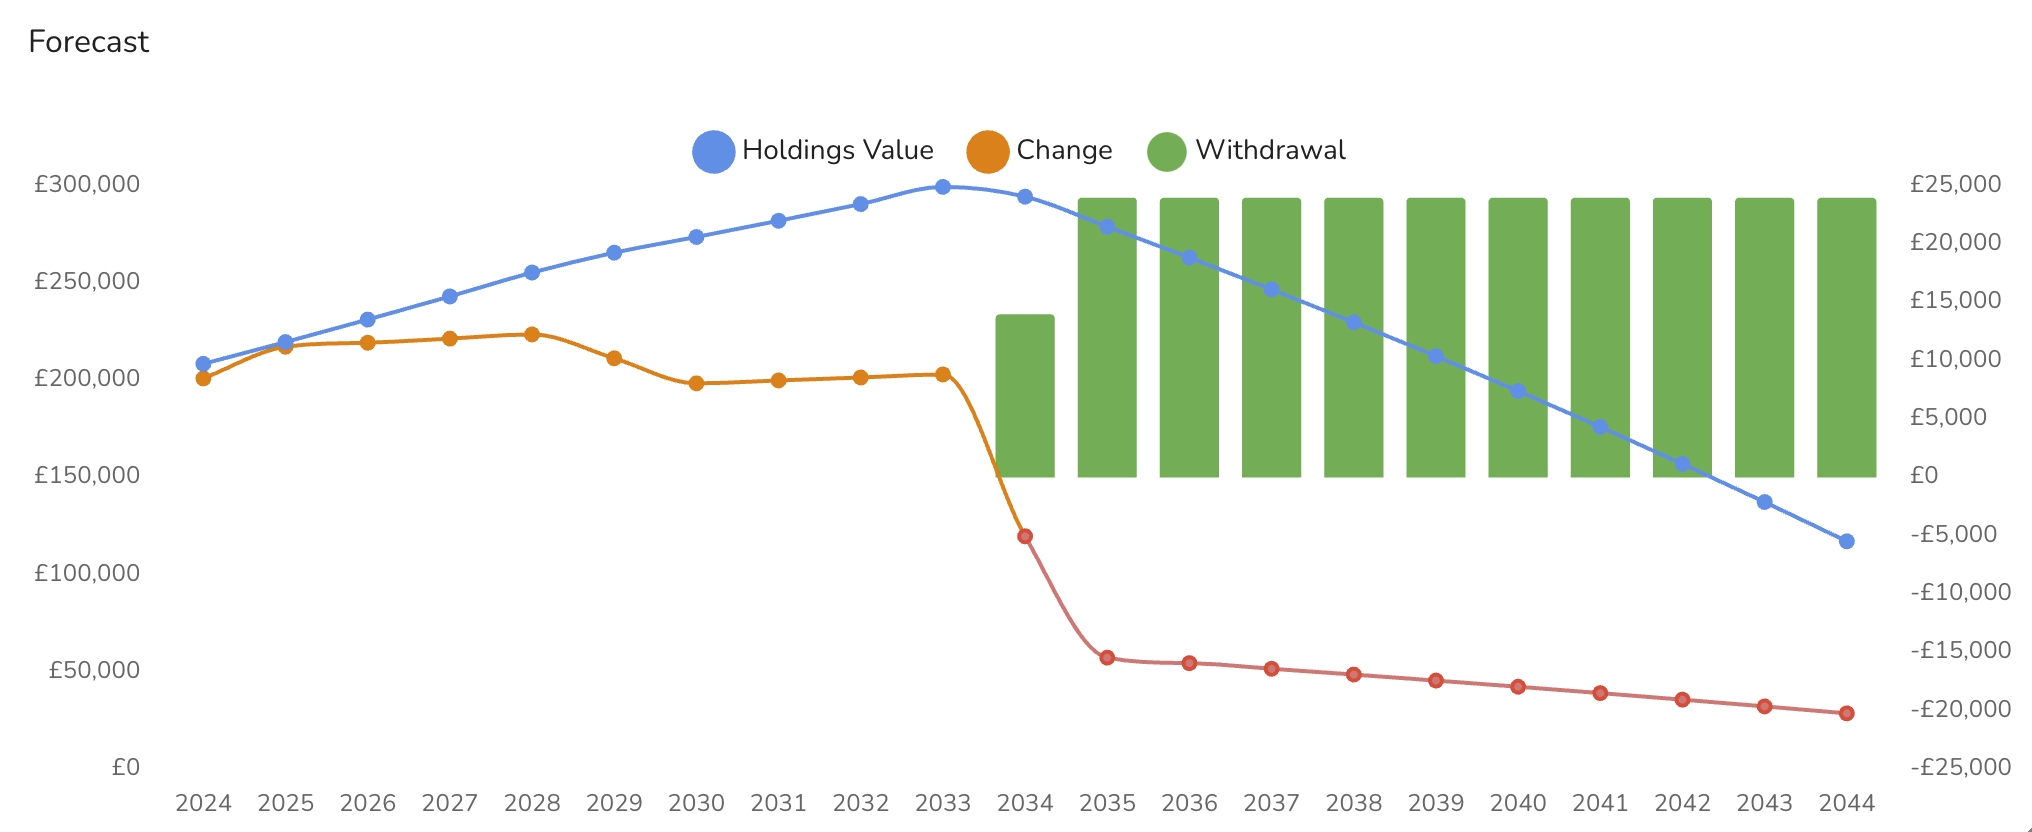
The chart provides a comprehensive visualization of your portfolio's forecasted value. It includes:
- Holdings Value: A line showing the projected value of your holdings over time.
- Change: A line indicating the change in your portfolio value.
- Withdrawal: Bars representing the amount withdrawn from the portfolio at specified intervals.