Holding Prices Over Time

Overview
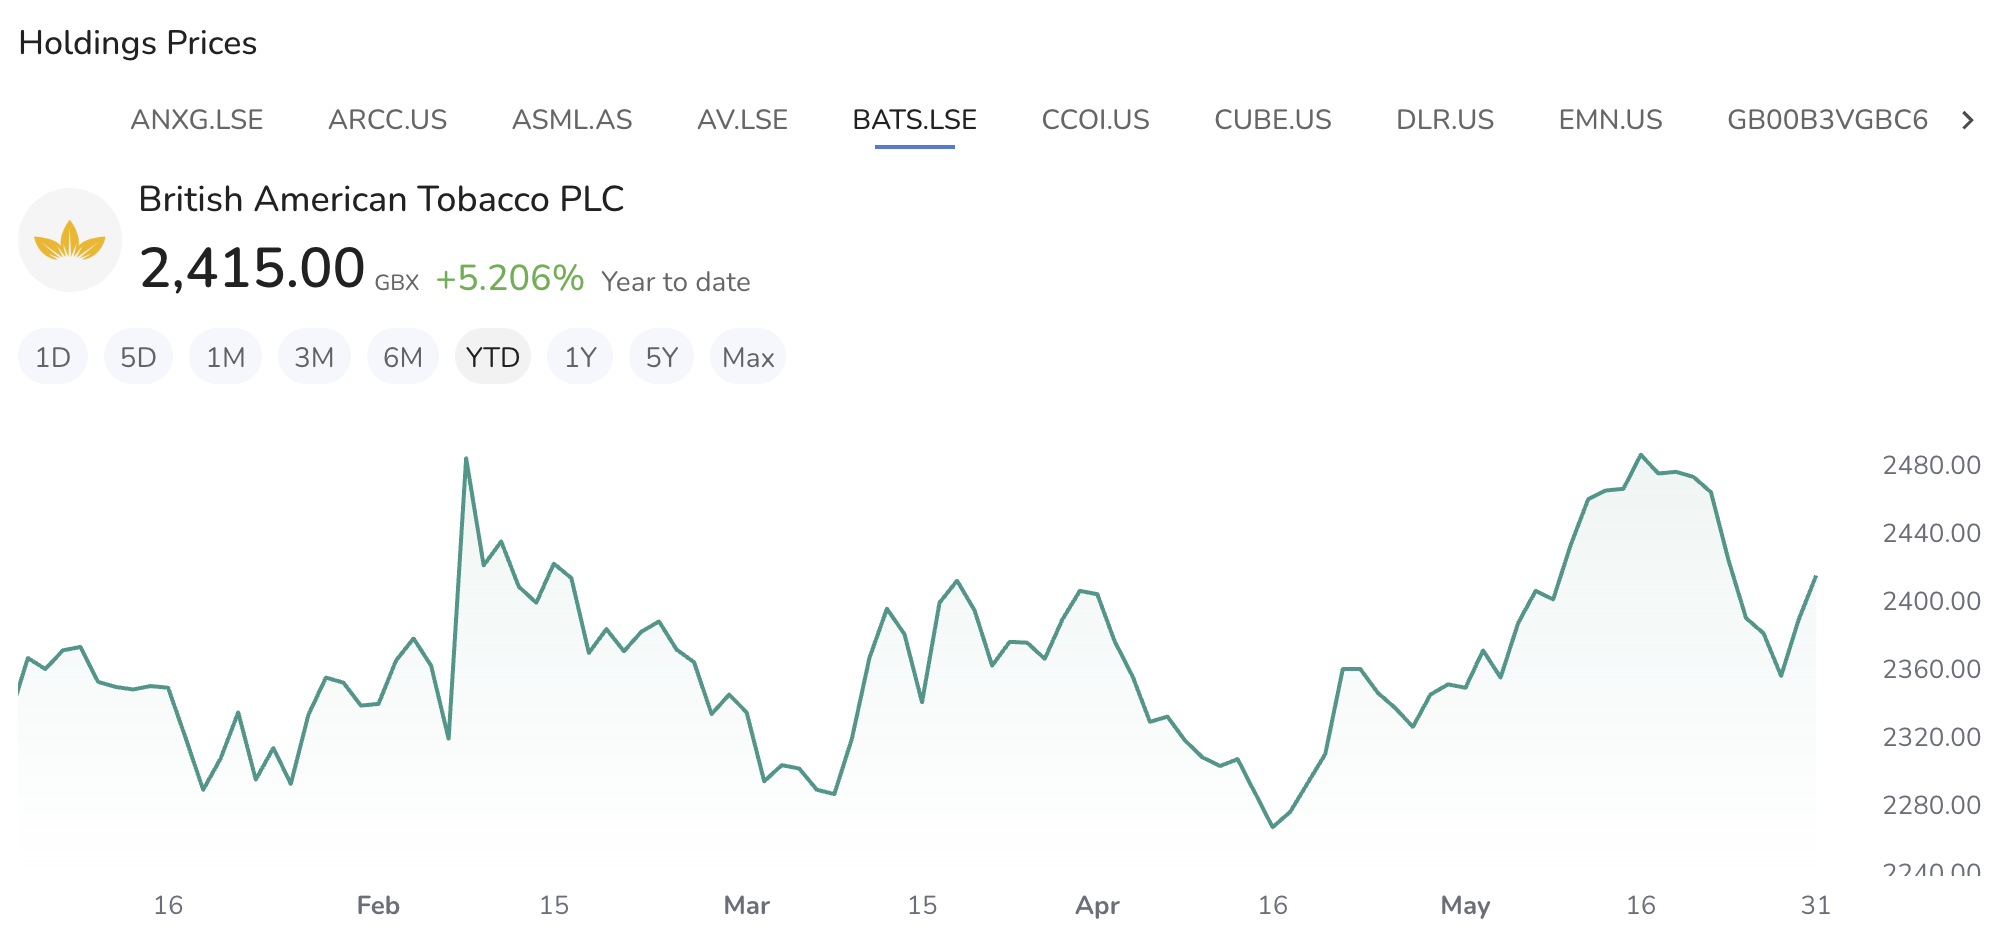
The Holdings Prices Widget displays the price change of your selected holding over various time periods. Customize the view with different chart types and display settings for a comprehensive analysis of your investment performance.
Data Displayed
- Current Price: This shows the current market price of the selected holding.
- Percentage Change: This indicates the percentage change in the holding's price over the selected time period.
Settings
-
Accessing Settings:
- Click on the settings icon to open the settings menu.
-
General Settings:
- Ticker Displays: Choose which tickers to display.
- Options include "All Tickers" or specific tickers.
- Ticker Displays: Choose which tickers to display.
-
Header
- Toggle: Toggle to show or hide the header and ticker logo.
- Change: Choose how to display the change information.
- Price & Percent
- Percent only,
- Price only,
- No values
-
Chart Settings:
- Chart Type: Select the type of chart to display.
- Options include "Line" and "Area."
- Chart Type: Select the type of chart to display.
-
Saving Changes:
- After entering all the necessary information, click "Save" to apply your changes.
- Buttons:
- Default: Resets the settings to default values.
- Cancel: Discards any changes made.
- Save: Applies and saves the changes.